Click the Arrow below and see my monthly real estate update. Some of the facts and data are below in graphs and dialog.
Let me know if you have any questions.
Click on any graph to make it bigger.
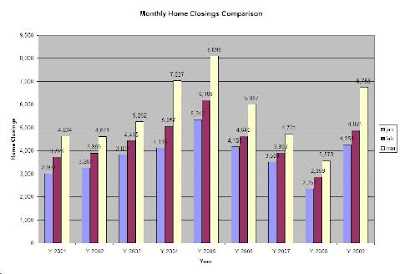
Home closings soared in March. At the graph was created 6,755 single family home closings were recorded in March. That number has been adjusted up to 6,851 as of April 3rd. This represents the 3rd best March ever for single family home closings. At the rate homes are selling we should close over 8,000 in April. When comparing to May of 2006, a time when the market was in good condition, we now have about the same amount of homes on the market as we did in May of 2006, but we are selling twice as many homes. Over 2,400 single family homes sold last week, compared to about 1,200 in May of 2006.
Again, click on the graph to make it larger and easier to read.
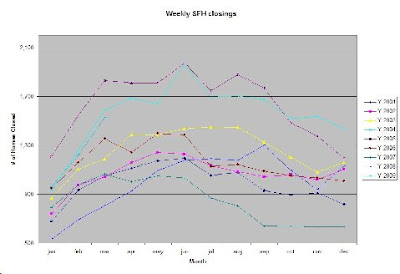
Below is a graph of weekly home closings in the metro Phoenix area. You will see the partial line which is 2009. The home sales in 2009 are substantially higher than any other year, other than 2004 and 2005. Demand has returned to the market.
 Click on the graph to make it larger and easier to read.
Below is a graph of the inventory levels of single family homes over the past 3 years. You can see, supply is contracting. The fact that demand is increasing while supply is decreasing, these are the ingredients for a market recovery. Remember 70% of the homes selling today are in need of some level of rehab. This should start to bring more demand to other goods and services for home improvement, appliances and landscaping.
Remember to see new listings of foreclosed homes before most Brokers have a chance to see them, visit: www.ArizonaBankDeals.com
Jeff Cameron


480-652-2004